
Mechanical optimization levels for defense and aerospace sites
The IH Services Mechanical Optimization Levels
Five levels of facility maintenance, from run-to-failure to IoT reliability. Each level up gives you more strategic impact and more performance and resilience, and each one asks more of your data, tools, and people.
The Mechanical Optimization Levels rank how a site maintains its building systems: Level 1 reactive, Level 2 preventive, Level 3 condition-based, Level 4 predictive, and Level 5 IoT-reliability maintenance. As a result, strategic impact and performance and resilience rise with every level. The right target for each asset depends on how critical it is, so most sites run a deliberate mix.
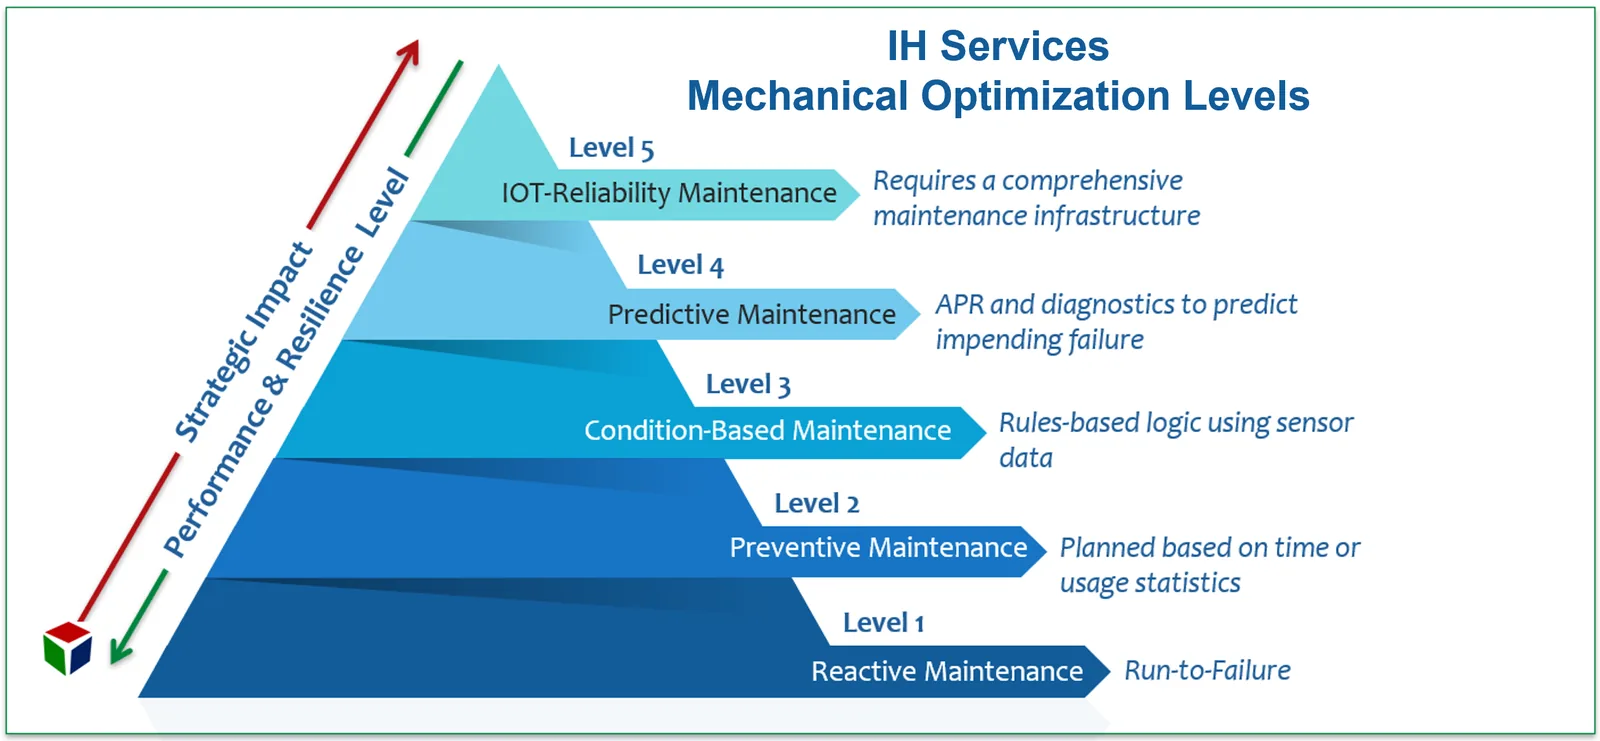
How to read the Mechanical Optimization Levels
The pyramid makes two points. First, the base carries the top. You cannot predict the failure of an asset that is missing from your register, and you cannot connect a sensor to a maintenance plan that does not exist. Second, the two arrows along the side measure what each level is worth to you.
Strategic impact
How much your maintenance program informs the decisions above it: budget certainty, capital planning, energy, and mission readiness. At Level 1, maintenance is a cost you react to. At Level 5, by contrast, it is evidence you plan with.
Performance and resilience
How well your building systems stay available, and how fast the site recovers when something does fail. Each level catches problems earlier, so failures get smaller, rarer, and shorter.
The five mechanical optimization levels, one at a time
For each level below, you will find what triggers the work, what it needs, and what it gives you in strategic impact and in performance and resilience.
Reactive maintenance
Run to failure
Work starts when something breaks. Because there is no plan, the failure sets the schedule.
What it needs
A work-order desk, technicians on call, and spare parts.
Strategic impact
Low. As a result, maintenance shows up as an unplanned cost, and your capital plan rests on guesses about remaining life.
Performance and resilience
Low. Every failure becomes an outage, an emergency call, and overtime. Worse, in a closed area it also means finding an escort at the worst possible hour.
The DOE FEMP O&M Best Practices Guide reports that more than 55% of maintenance resources and activities at an average facility are still reactive.
Preventive maintenance
Planned on time or usage
Tasks run on a calendar or a usage count, for example monthly, quarterly, or every 2,000 run hours.
What it needs
An asset register, task lists for each asset class, and a CMMS that schedules and tracks the work.
Strategic impact
Moderate. Work becomes plannable and budgetable. In addition, documented preventive maintenance keeps many manufacturer warranties valid.
Performance and resilience
Better. You get fewer surprises. However, time-based tasks can come too early, which wastes labor, or too late, which misses the failure.
According to the same FEMP guide, studies show preventive maintenance can save as much as 12% to 18% on average compared with a purely reactive approach.
Condition-based maintenance
Rules-based logic using sensor data
Work starts when a measured value crosses a set limit: filter pressure drop, motor amps, bearing temperature, vibration, or refrigerant pressure.
What it needs
Sensors or building automation points on the assets that matter, defined limits, and alarms routed into the CMMS as work orders.
Strategic impact
Higher. Maintenance spend follows actual condition. Therefore, labor goes where the data says it is needed.
Performance and resilience
Higher. Degradation is caught before it becomes a failure. At the same time, unneeded calendar tasks drop away.
Predictive maintenance
APR and diagnostics to predict impending failure
Advanced pattern recognition (APR) learns each asset’s normal operating pattern and flags drift early. Then diagnostics such as vibration analysis, infrared thermography, oil analysis, and ultrasound confirm the cause.
What it needs
Clean operating history, analytics software, and, above all, technicians trained to read the results.
Strategic impact
High. Repairs move into planned windows. In addition, replacement years go into your capital plan with evidence behind them.
Performance and resilience
High. In the industrial surveys the FEMP guide cites, organizations that started predictive programs reported 35% to 45% less downtime and 70% to 75% fewer breakdowns.
FEMP also reports that a predictive program can save 8% to 12% over a program that uses preventive maintenance alone.
IoT-reliability maintenance
Requires a comprehensive maintenance infrastructure
Connected sensors on critical systems feed one data platform. Reliability engineering, including reliability-centered maintenance and root cause analysis, then designs repeat failures out.
What it needs
In short, the full stack: a complete register with criticality, connected sensors, CMMS and data integration, reliability engineers, data governance, and cybersecurity that fits your site.
Strategic impact
Highest. As a result, maintenance becomes a reliability program that informs capital planning, energy use, and mission readiness.
Performance and resilience
Highest. Systems stay available because failure modes are engineered out. Even when something does fail, the site recovers faster.
Mechanical optimization levels side by side
| Level | What triggers the work | What it needs | Strategic impact | Performance and resilience |
|---|---|---|---|---|
| Level 1: Reactive | A failure | Work-order desk and parts | Low | Low |
| Level 2: Preventive | The calendar or a usage count | Asset register, task lists, CMMS | Moderate | Better |
| Level 3: Condition-based | A measured value crosses a limit | Sensors or automation points, limits, alarm routing | Higher | Higher |
| Level 4: Predictive | A pattern shows failure coming | Operating history, APR analytics, diagnostics, trained analysts | High | High |
| Level 5: IoT reliability | Connected data and reliability engineering | Full maintenance infrastructure | Highest | Highest |
Not every asset belongs at Level 5
Climbing the pyramid costs money. For that reason, spend it where failure costs the most. Set a target level for each asset by its criticality, the same principle behind reliability-centered maintenance:
- Critical systems that support production, secure spaces, or life safety, such as chillers, air handlers serving closed areas, switchgear, and fire protection, earn Level 3 to Level 5.
- Important systems, such as general-office HVAC, domestic water, and lighting controls, earn Level 2 or Level 3.
- Low-criticality assets, such as a light fixture in a storage room, can stay at Level 1 by design.
In other words, run-to-failure is fine when it is a decision. It becomes a problem only when it is the default. For how criticality, condition, and remaining life fit together, see facility asset management.
Secure sites: Level 4 and Level 5 tools must follow your security rules. Many closed areas restrict wireless devices and outside connections. So, at a cleared site, sensors often use wired building points, and dashboards run offline inside the controlled network. Your security office sets the rules, and the maintenance plan follows them.
IH Services delivers to the level you choose
You decide how far up the pyramid each system should go, and IH Services delivers to that level. For example, you might want preventive maintenance on office HVAC, condition-based maintenance on switchgear, and predictive maintenance on the chillers that serve a closed area. Whatever the mix, you set the target and we deliver it.
How a site moves up the Mechanical Optimization Levels
Five steps, in order. Each one builds the record the next level needs.
Know what you own
Build the asset register and rank each asset by criticality. After all, every level above Level 1 stands on this record.
Plan the work
Write preventive task lists by asset class, schedule them in the CMMS, and keep warranty requirements current.
Measure what matters
Next, add sensors or automation points to critical assets, set limits, and route alarms into work orders.
Learn the pattern
Then build clean operating history, add pattern recognition and diagnostics, and plan repairs before failure.
Engineer reliability
Finally, connect the data, apply reliability-centered maintenance and root cause analysis, and govern the program.
Why the level matters to your budget
Each level changes when you spend and what you know. At Level 1, an asset fails without warning and the replacement lands as an emergency capital request. At Level 4, however, the data shows the decline years ahead, so the replacement goes into the plan on a date you choose. That is why higher levels extend asset life and protect capital, a link we explain in OpEx vs CapEx.
The level also belongs in your contract. If you are rebidding an O&M or IFM contract, write the target level for each asset class, the data you expect, and your ownership of that data into the scope. For example, our guide to second-generation IFM contracts shows how.
Mechanical optimization levels: questions buyers ask
What are the IH Services Mechanical Optimization Levels?
The Mechanical Optimization Levels are a five-level model of how a site maintains its building systems. It starts with Level 1, reactive maintenance (run to failure). Next comes Level 2, preventive maintenance planned on time or usage. Then Level 3, condition-based maintenance, applies rules to sensor data. After that, Level 4, predictive maintenance, uses advanced pattern recognition and diagnostics to predict failure. Finally, Level 5, IoT-reliability maintenance, needs a full maintenance infrastructure. As a result, strategic impact, performance, and resilience rise with each level.
What is the difference between preventive and predictive maintenance?
Preventive maintenance runs on a calendar or a usage count, whatever the asset’s actual condition. Predictive maintenance, in contrast, watches the asset and acts when the data shows failure coming. According to the DOE FEMP O&M Best Practices Guide, a predictive program can save 8% to 12% over a program that uses preventive maintenance alone.
What is condition-based maintenance?
Condition-based maintenance starts work when a measured value crosses a set limit. For example, a filter is changed when its pressure drop reaches the limit, not every 90 days. In short, it uses rules-based logic on sensor or building automation data, so labor goes where the condition calls for it.
What does APR mean in predictive maintenance?
APR stands for advanced pattern recognition. The software learns how each asset normally runs from its own operating history. Then it flags small changes in that pattern, often well before an alarm limit is reached. Teams pair it with diagnostics such as vibration analysis, infrared thermography, oil analysis, and ultrasound to confirm the cause and plan the repair.
Is run-to-failure ever the right maintenance strategy?
Yes, for assets whose failure is cheap, safe, and quick to fix, such as a light fixture in a storage room. The difference is intent. Run-to-failure should be a decision you make for low-criticality assets, not the default for your whole site.
What does Level 5 IoT-reliability maintenance require?
It requires a comprehensive maintenance infrastructure: a complete asset register with criticality rankings, connected sensors on critical systems, a CMMS tied to a data platform, reliability engineering methods such as reliability-centered maintenance and root cause analysis, trained people, and data governance. Without that base, connected sensors produce alarms, not reliability.
Can IoT sensors be used in secure or closed areas?
Sometimes, but only within your site’s security rules. Many closed areas restrict wireless devices and outside connections. So, at a secure site, Level 4 and Level 5 tools often run on wired building points or on systems that work offline inside the controlled network. Your security office sets those rules, and the maintenance plan follows them.
Which maintenance level should my site be at?
More than one. Set a target level for each asset by its criticality. Critical systems that support production, secure spaces, or life safety earn Level 3 to Level 5. Important systems earn Level 2 or Level 3. Low-criticality assets can stay at Level 1 by design. To see where your systems sit today, request a no-cost asset assessment.
Which mechanical optimization levels does IH Services deliver?
IH Services delivers to the level you want to achieve. You set the target level for each system, from preventive maintenance to IoT reliability, and we deliver maintenance at that level. As your goals change, the target can change with them.
Does the model cover production equipment?
No. The Mechanical Optimization Levels apply to building and facility systems: HVAC, electrical distribution, plumbing, life safety, and the building envelope. Production equipment stays with your team, on your side of the yellow line.
Sources
- U.S. Department of Energy, Federal Energy Management Program, O&M Best Practices Guide, Release 3.0, Chapter 5: Types of Maintenance Programs (Pacific Northwest National Laboratory, August 2010). Source of the reactive share, preventive and predictive savings, and the industrial survey results on downtime and breakdowns.
- U.S. Department of Energy, Federal Energy Management Program, Operations and Maintenance Best Practices Guide. Release 3.0 remains the current edition the program offers.
- Pacific Northwest National Laboratory for the Federal Energy Management Program, O&M Best Practice Issue Discussion: Maintenance Approaches (July 2021). Restates the preventive and predictive savings ranges from the 2010 guide.
Which level are your critical systems at today?
Start with a no-cost asset assessment. Send us your asset list and a year of work orders under NDA. In return, we will show you where your critical systems sit on the Mechanical Optimization Levels and what it takes to reach the level each one needs.